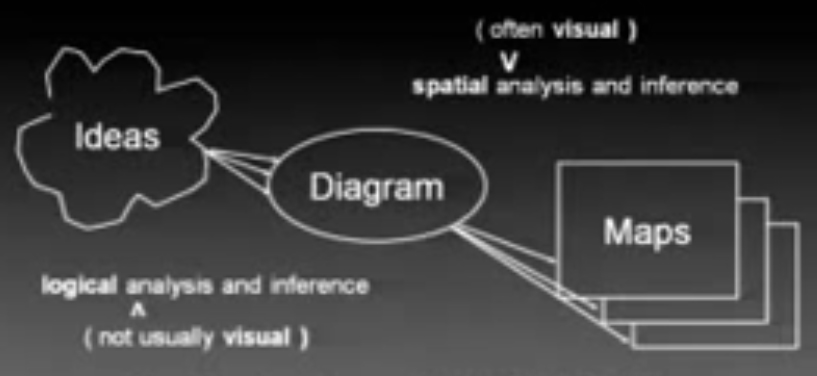
Diagrams are one of the foundational communication concept inside Geodesignhub. You can think of a diagram as a representation of a idea that can be easily understood and communicated. The closest analogy is a explaining something to someone using a back of a napkin, you are going to use rough sketches, some text etc.
Prof. Steven Ervin explains diagrams the best, I would really recommend that you listen these two short videos (~ 5 mins each) on YouTube: here and here.
Diagrams are form the basis of design negotiation and are a fundamental object type in Geodesignhub. Diagrams are objects that represent past, current and future ideas of interventions that are created by users and others in a project. Diagrams have three things:
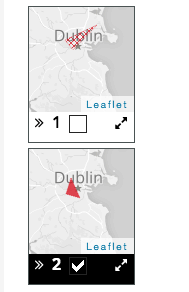
- A representation on a map (e.g. line or polygon on a map)
- A short text describing what the diagram communicates.
- Other meta data attributes such as a cost, timeline, funding type etc.
There are primarily two types of diagrams: Projects and Policies. Projects are ideas that involve construction, building something, moving something and are necessarily linked to a location. For e.g. building a new shopping mall is a project. The second type of diagram is a policy. Policies are things that are not necessarily spatial i.e. linked to a specific location. For e.g. a water management training or education program is not linked to a specific house but to all of the area. A policy could be a rule, regulation that can be introduced as a part of the design strategy. E.g. to promote opening of new businesses, a tax break could be implemented for new businesses. These type of economic tools are examples of policies that can be pursued. A effective geo-management and strategy consists of both projects and policies. The policies are depicted as hatched patterns and projects as solid pattern in Geodesign and a example is below.