In this article, I will detail two advanced features that are now live for your projects in Geodesignhub that you can use for your Geodesign projects.
If you are new to Geodesignhub, I will briefly recap, Geodesignhub is a social / collaborative software used to facilitate and conduct digital negotiations around complex issues of planning and management of neighborhoods, cities and regions. Geodesignhub provides a unique digital user interface and a method to setup and facilitate negotiations across different stakeholders with different backgrounds and understanding of the issues. The goal of these negotiations is to develop a consensus around priority actions and agreements regarding proposed strategy.
Similarity Analysis
The first update that is now available in Geodesignhub is a simple similarity analysis between two designs. When comprising two design alternatives, the designs are normally displayed side by side and there are advanced comparison tools that compare the two alternatives.
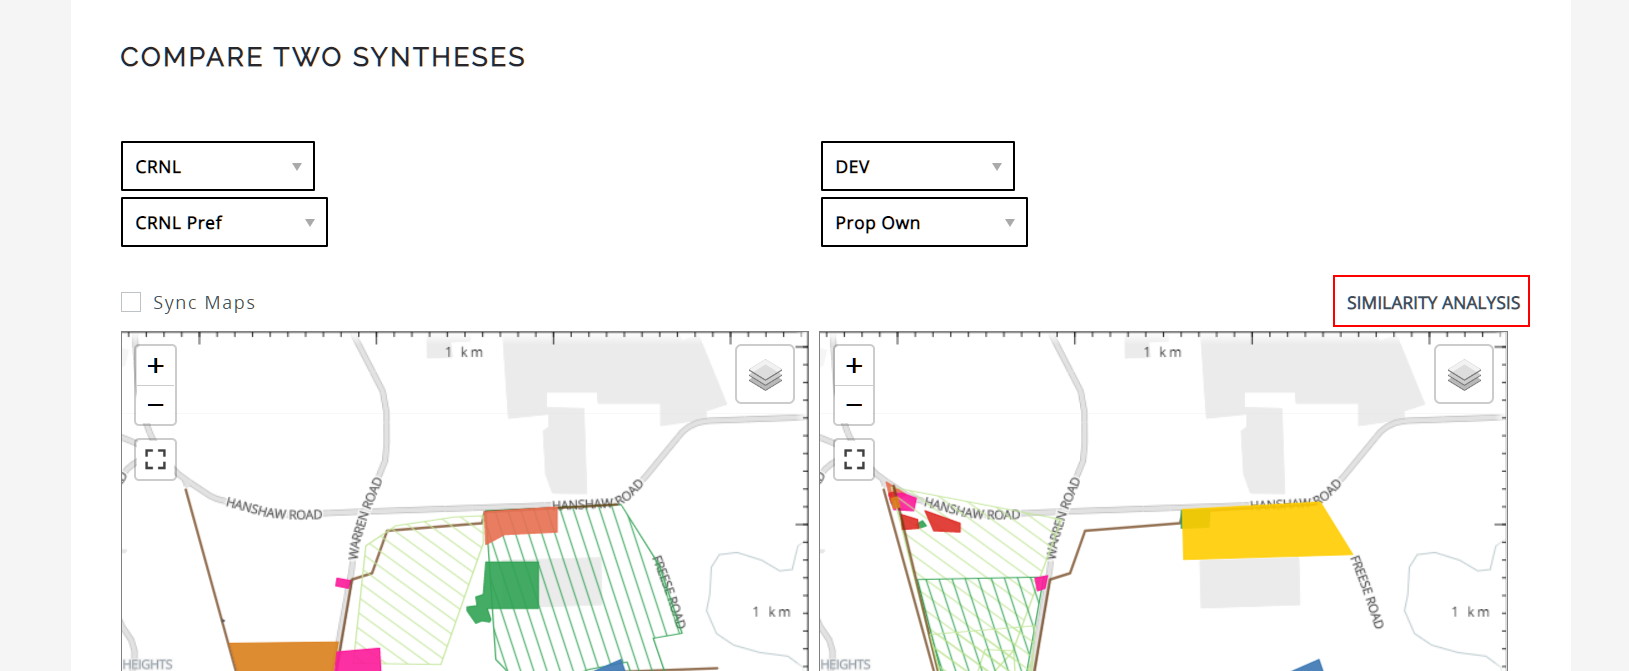
Additionally, now there is a slope graph that is available for comparing the areas between the two designs to understand the size of the changes proposed between the two designs. The slope graph compares areas between the two designs.
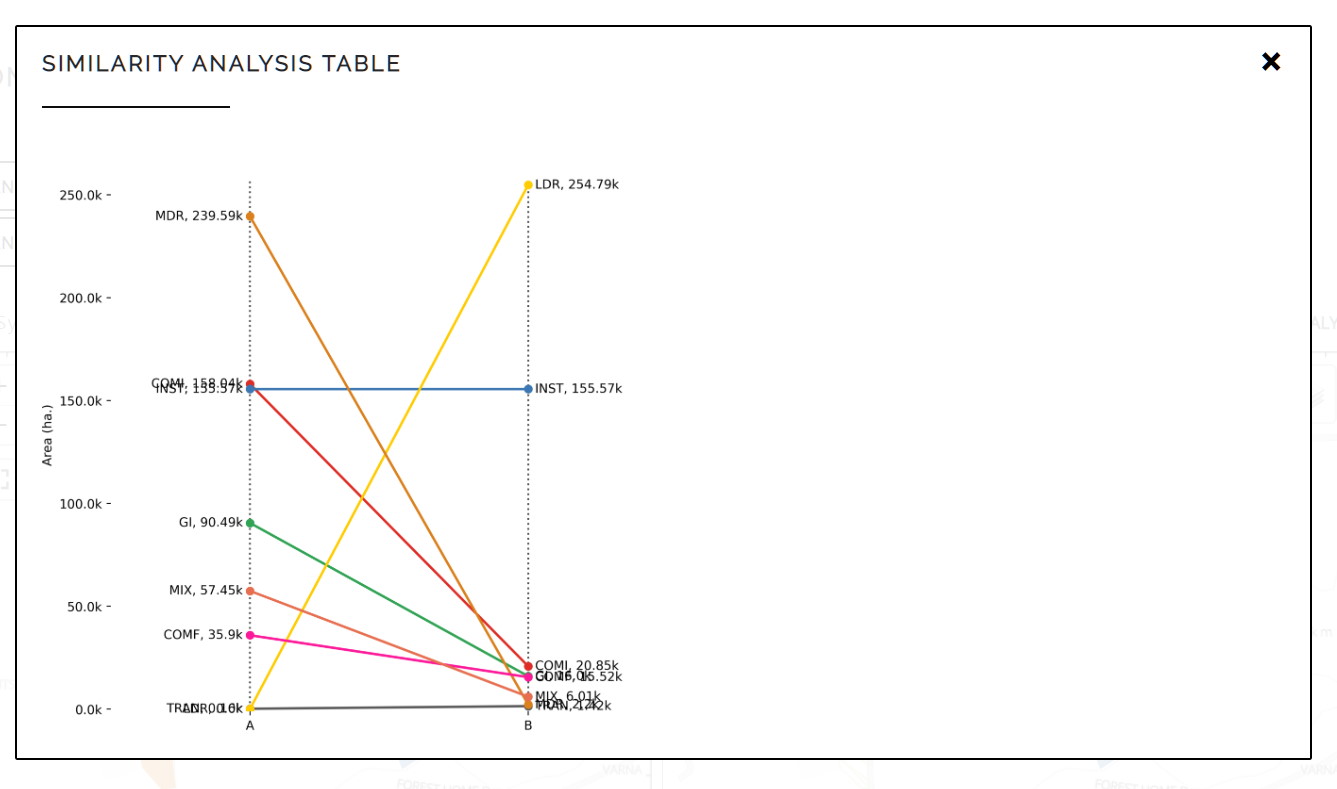
Comparing areas between two designs is just one way of comparing two designs, there are of course additional measures that can be developed to enable comparison between two designs.
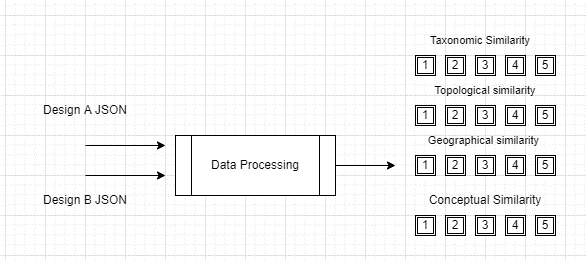
Specifically we are working on the four types of design similarities:
- Taxonomy: Different words for same idea (identify main ideas / themes)
- Topology: different geometries for same place (are the geometries large or small for a location)
- Geography: different places for same idea (does a theme repeat in different places)
- Conceptual: different ideology for same place (are there different ideas for the same place)
A new similarity analysis engine is being developed to enable this type of index for Geodesignhub. The goal of this is to enable a host of these measures available for your design negotiations on the fly between any two designs.
Updates to selection summary
Geodesignhub works in the context of diagrams and the negotiation participants are asked to pick from a selection of available projects and polices represented as diagrams. In addition to having a geometry, diagrams in Geodesignhub have many attributes: costs, funding type, whether they are projects and policies etc. The selections are displayed on a map and the metadata is summarized in the user interface.
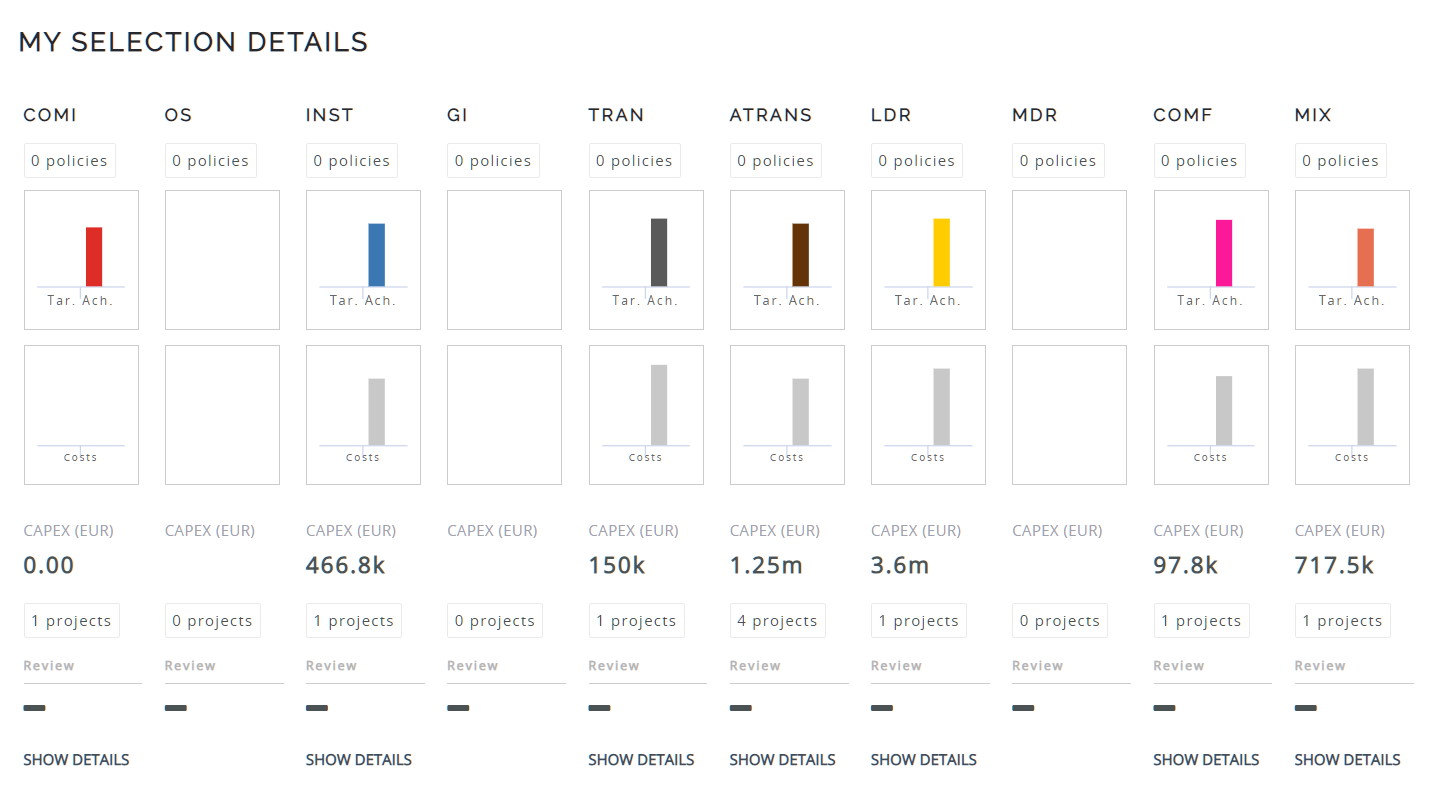
With the recent updates, there is now a detailed and consolidated table around the details of the selections around the CAPEX costs, the number of diagrams split between number of projects and policies split by the individual themes.
Conclusion
These tools are available for your negotiations and by utilizing a analytical framework for negotiations we can develop robust evidence based negotiation methods to generate maximum consensus between parties.