In this article, I will describe a critical update to the platform around representation and visualization of policy diagrams.
Background
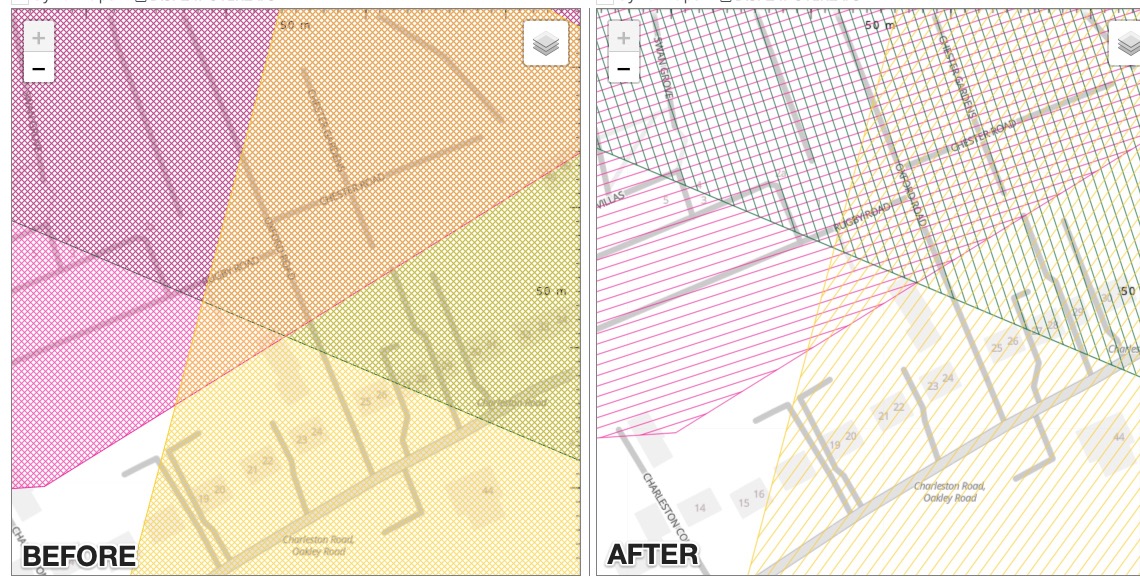
If you are new to this, I would recommend that you read the What is a Diagram? and the difference between projects and policies. When we add policy diagrams, they are represented as a dense cross hatch as shown below. The figure below shows three policy diagrams that have areas that overlap.
The problem
In many Geodesign projects, it is common to have many projects and policies. The image and many like it generally work, there are three problems with it:
- In the areas where the diagrams overlap, the colors are combined and you get a “orange / brown” color mixing as can be seen above.
- The second issue has to do with the ordering of these layers also known as z-ordering, long story short, it is difficult to control layer positioning (e.g. put yellow at top) in this “sandwich”.
- The second major problem here is that, the three polygons communicate different ideas but are represented with the same cross-hatch pattern generating a equivalence.
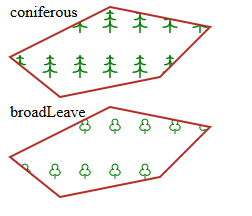
To be clear, this is a solved problem in other fields: e.g. in engineering drawings below and using dynamic hatching in maps (sieve mapping). Using different hatching patterns can enable us to build interesting visualizations when we do overlap analysis. It was just that in Geodesignhub, we decided to go with a cross hatch pattern for the sake of simplicity but we encounter many cases where the cross hatch does not work.
source - source
Removing cross hatching
My PhD advisor, Prof. Carl Steinitz pointed this issue to me. As I thought about redesigning the cross hatching, I started to look at a set of hatches that can be accommodated for Geodesignhub. For every project, we need ten of these hatching patterns available at any time. These patterns in Geodesignhub are generated using SVG. Scalable Vector Graphics or SVG if you are not familiar with it are a way to generate vector geometry. I am not going to go into the details of SVG, I found it quite confusing especially the paths. While looking to generate SVG hatching dynamically, I found this great hatching chart on Inkscape.

source
Using this as a inspiration, I started to work on building a new hatching pattern. Since we are not going to use cross hatching we will focus on the first two rows. So I set about picking one of the single hatch and then implemented it on Geodesignhub and rotating it for every system, resulting in the following changes.
This is now live and available for your project. This is the first iteration of this and I am currently refining the path geometry calculations and as we progress, we will see additions and sophisticated hatching patterns including glyphs and others are coming.
A sneak peak is here:
source
Onwards! ![]()
![]()