In Geodesignhub, a diagram can have features (represented as lines or polygons) as one of four entities:
-
Evaluation features (in Red, Yellow, Green color)
-
Constraints (in Black)
-
Projects (in solid color)
-
Policies (in a cross-hatching)
Policies are projects are usually added by the participants in the workshops. Geodesignhub enables two types of drawing to encapsulate ideas for a change.
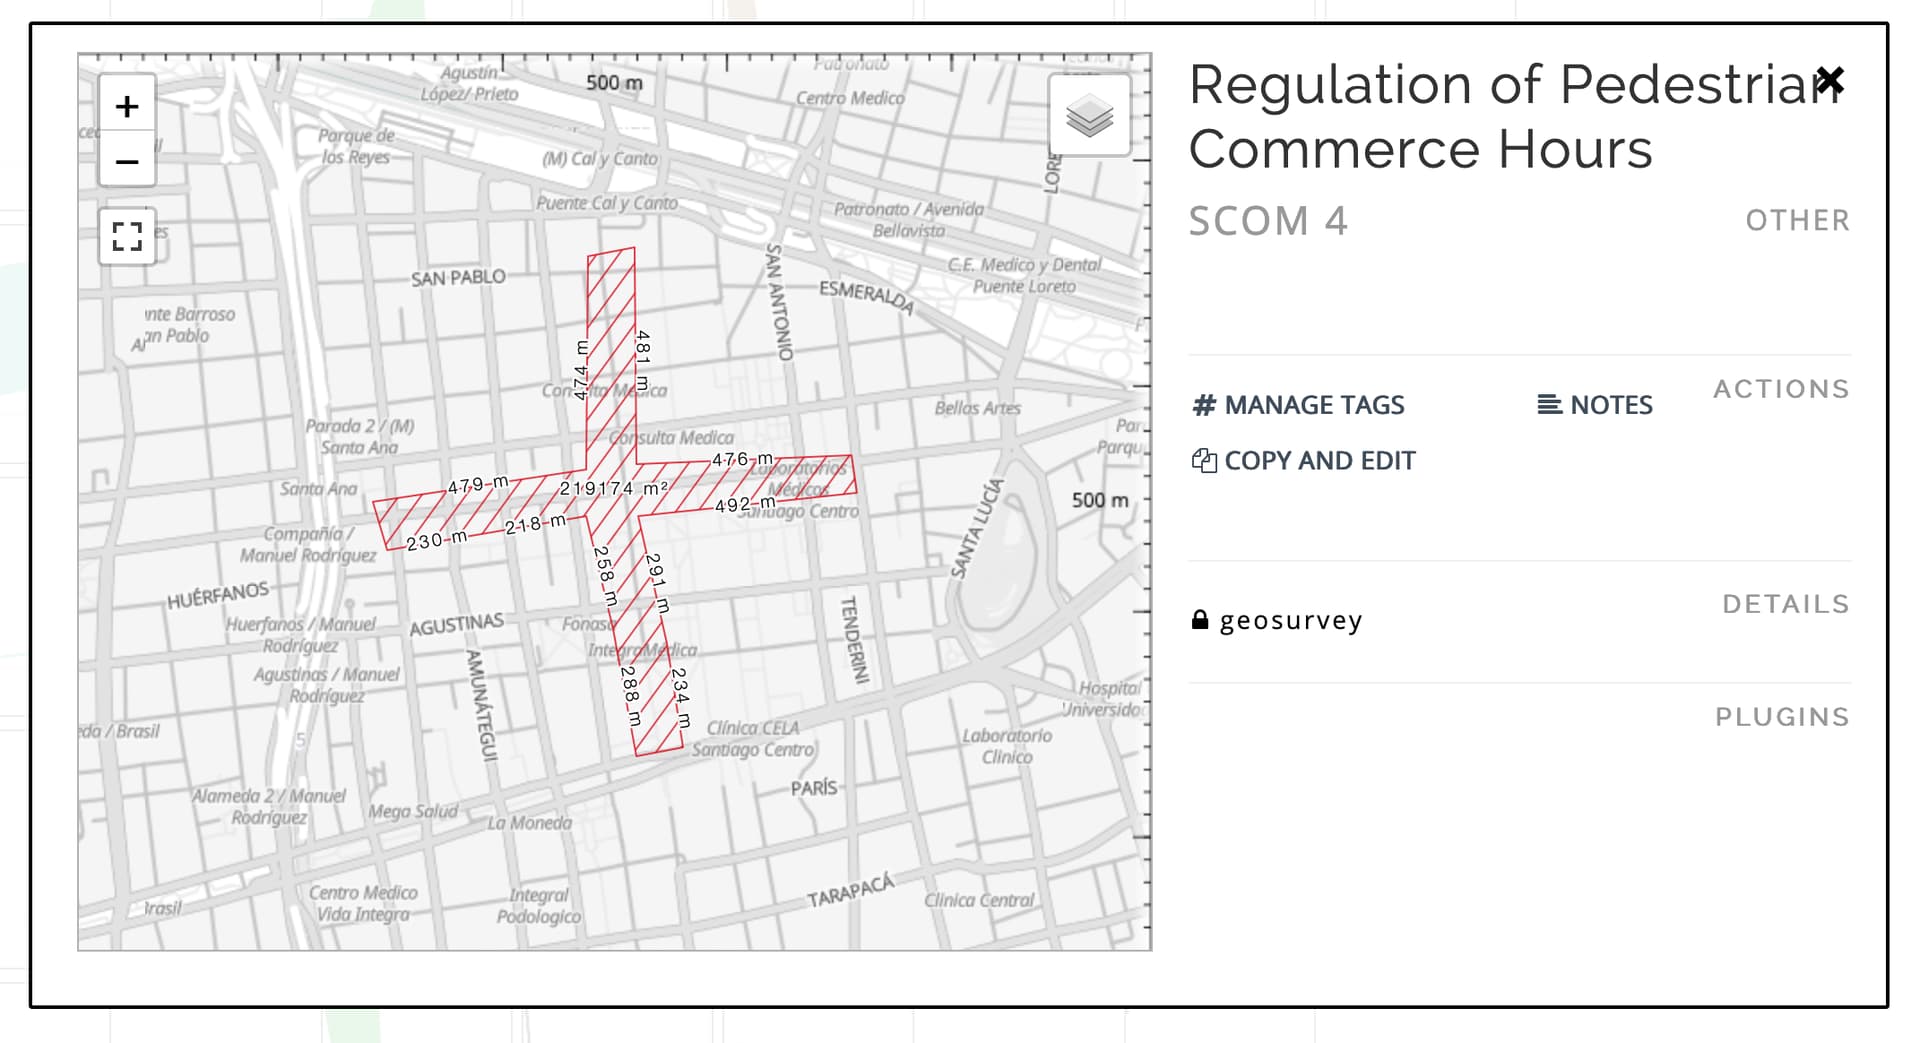
Policy
A policy is an idea that will not or cannot have a physical change manifestation on the study area. For example: “Increase Municipal Taxes” is an idea that is a policy. It is done via a legal or statutory framework and it will not have a direct physical impact on the site. It is shown as “hatches” in the system (example below). It should also be noted that policies do not have a cost or an impact; in the real world of course, costs of policies can be quantified but given the variance in costs and the cost models, in Geodesignhub, we do not use policies for cost calculations and impact assessments.
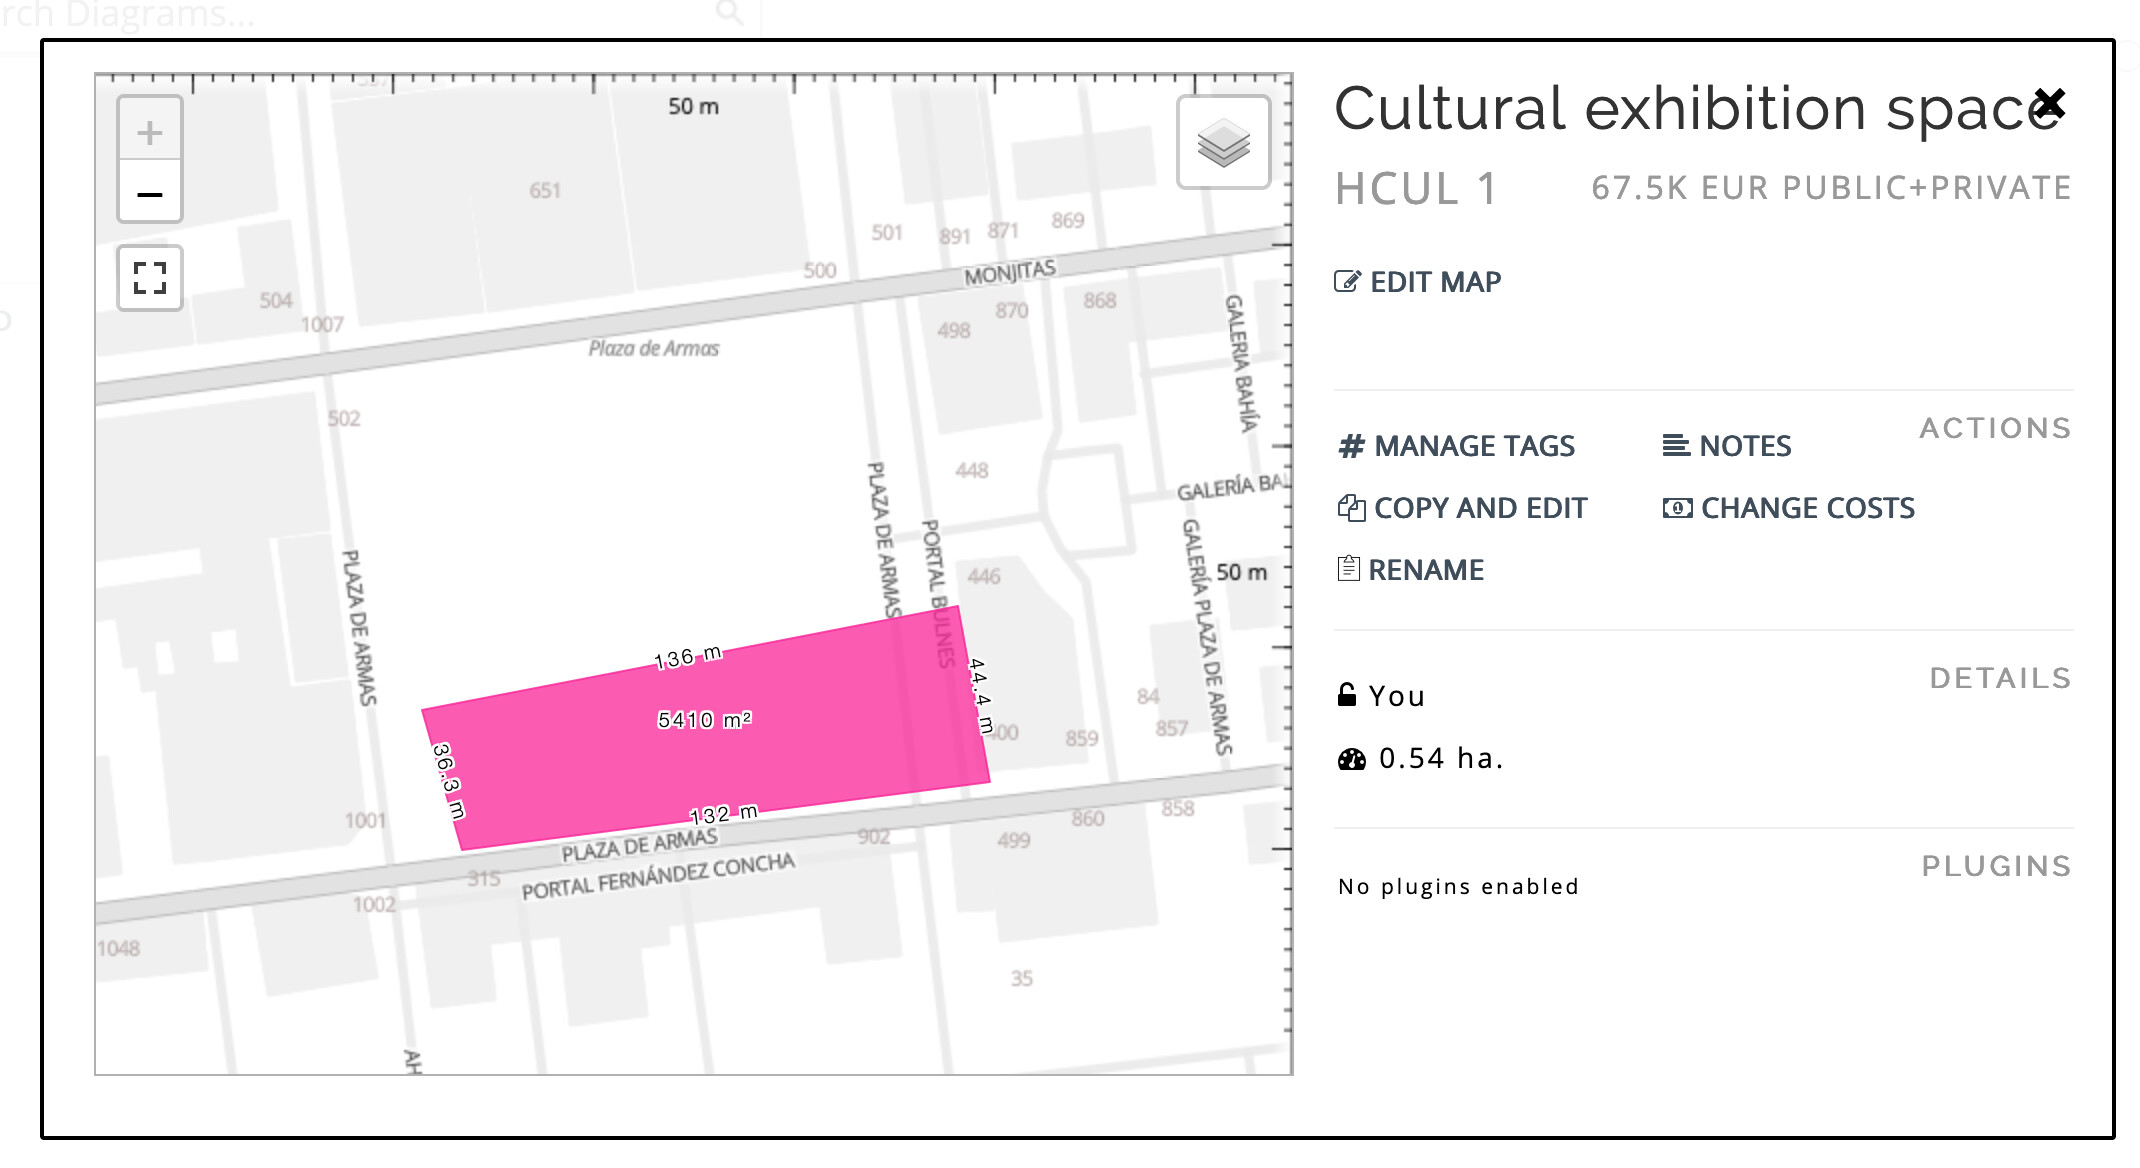
Project
A project is an idea that will have a material physical impact on the study area. For example, an idea to build a mall in a study area means construction, project planning, etc. It will have a budget, a timeline that can be quantified, and in addition a start and an end date. In Geodesignhub, projects are depicted in a solid color as shown below.