Not too long ago, I introduced our new new project management features for your Geodesignhub projects: Project Boards and Design Brief. In this post, I am going to introduce some additional advanced project management functionality that is now a part of Geodesignhub and is available for your project.
Boards are a way to go deeper into managing your interventions and way to work with your design over a longer period of time. We use boards to help with implementation and co-ordination of different activities and most importantly to understand and assess the capacity of the organizations to undertake different projects and move forward.
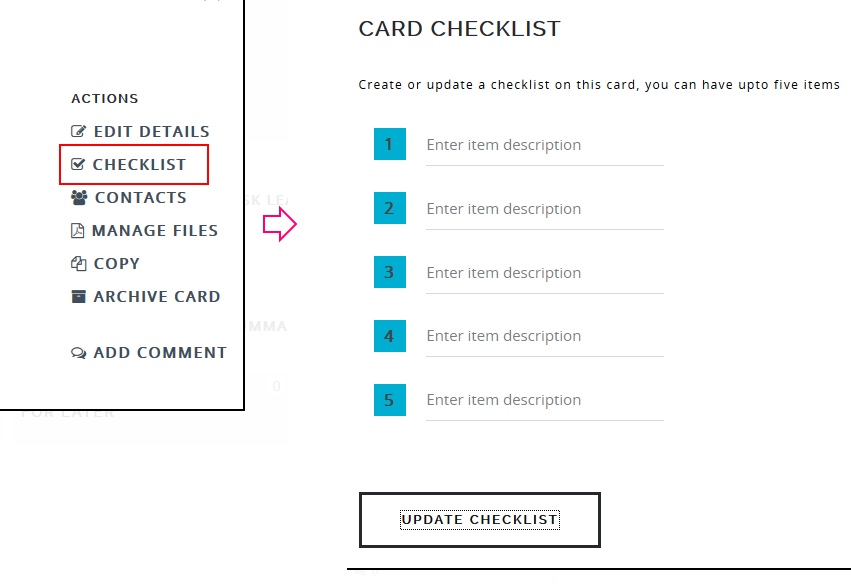
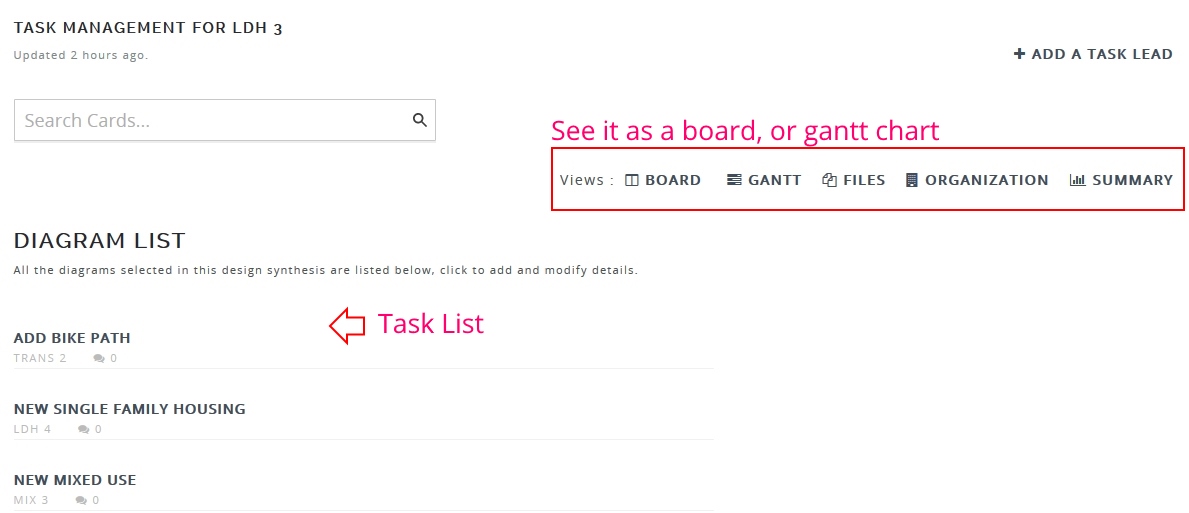
Task list and views
When you create a new board (see the link above for more details) by default a list of tasks appears as below
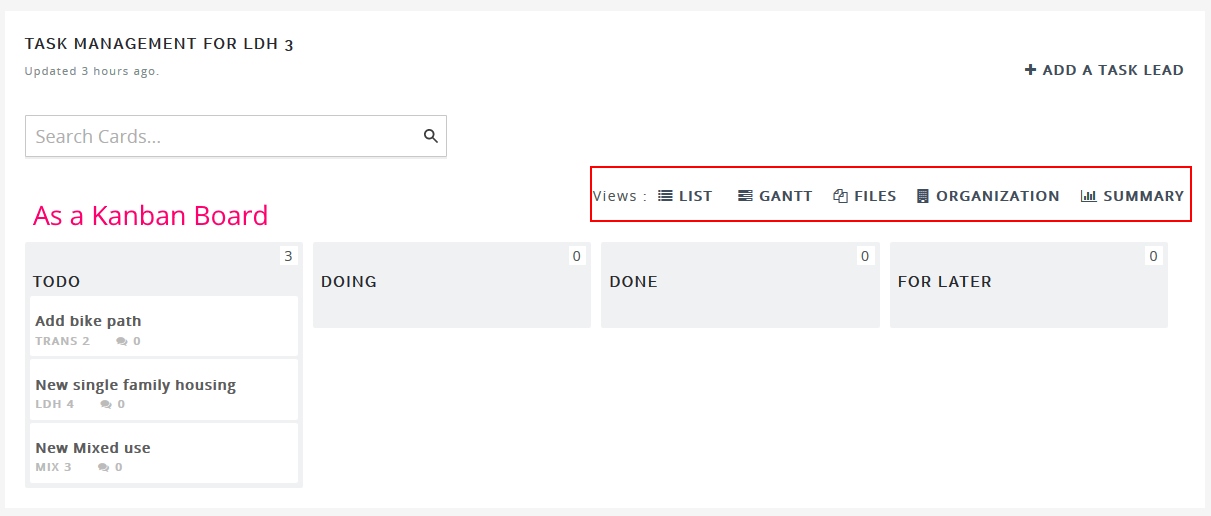
Of course you can see the exact same list as a Kanban board as shown below and it works exactly as expected, you can see the video of it in action in the link above
Geo-Gantt
You can now see your tasks as a Gantt Chart but it is just any ordinary gantt chart, it is linked to a objects on a map making it a “geo-gantt”. This simple link has a profound impact on management and understanding.
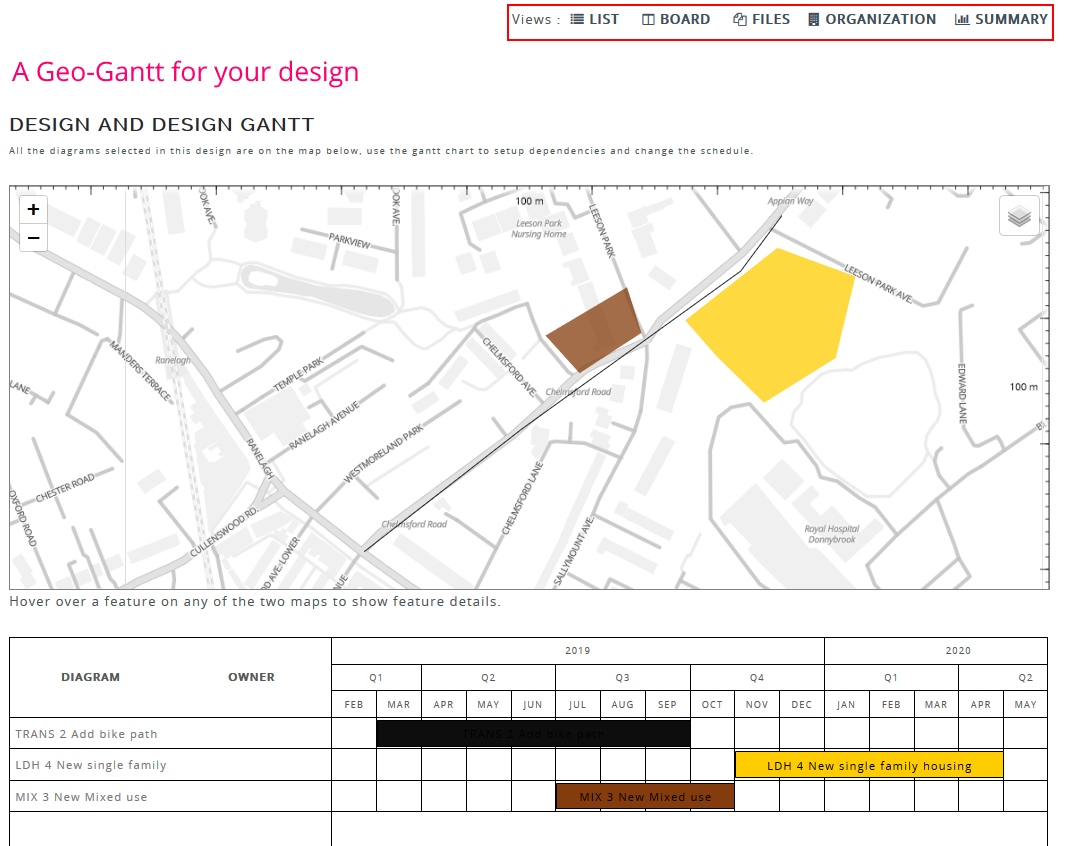
Gantt charts are a very common and popular way to organize a project and perform traditional project management functions around assigning resources, developing dependencies and analyzing bottlenecks in a project. One such dependency analysis is called the critical path method. Critical path can get quite technical and detailed but generally it is a good way to understand the key components of your project where you need to pay attention because any slips on the activities falling in the critical path mean that your delivery and the entire project schedule is in jeopardy. You can ask your project management friends if you want to know more.
You can see how a critical path analysis can be used to analyze dependencies in a “geo-gantt”.

When you have complicated set of a activities where the completion of one is a pre-requisite to the starting of other (e.g. the road must come first before we open the land for housing) any slips in the road construction mean that your housing will not be allocated and potentially means that your budgets and other organizational activities are in jeopardy. The above video just shows this for a couple of projects but you can do it across any number of projects or policies.
We can go even deeper in this by doing resource analysis. i.e. are the projects falling on the critical path properly resourced? For e.g. if the organization in-charge of building the road has no staff to do it or has their calendar full of existing work then most likely the road will not be built on time, putting the next steps in jeopardy. This type of analysis helps you understand the key risks. I will explain this in detail another blog post. But using techniques such as critical path and linking geographical data with a gantt chart we are ensuring that you are on top your project as you proceed to implement it.
Of course you dont have to use the inbuilt project management tools you can take everything out using our comprehensive API and use your favorite project management tool!
Happy geo-gantting! ![]()
![]()
![]()