In this post, you will learn the basics of impact calculations. Impacts are used to judge the performance of a design and use the information to inform the next iteration to make the design better.
Impact Basics
Let’s first understand the basics of how impacts are calculated. Geodesignhub overlays diagrams on evaluation maps, checked their intersection to compute impacts. It is a straightforward overlap intersection analysis.
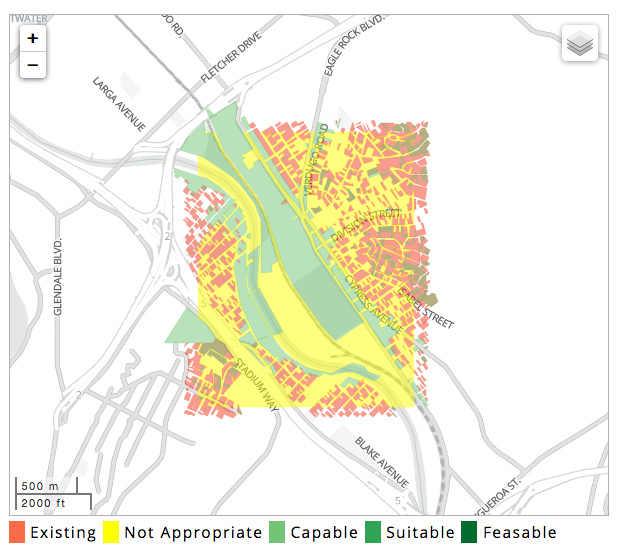
The evaluation map above has three colors: Red (Existing) / Yellow (Not Appropriate) and Green (Capable). When a diagram falls on any part of the evaluation map a impact can be calculated.
Once you have selected a set of diagrams, you can click on the “Compute Impacts” button to see how your design performs against the different assessments. You can use the information to make changes, add new diagrams and create new versions of your synthesis.

Below is a diagram that shows a Low Density Housing Proposal
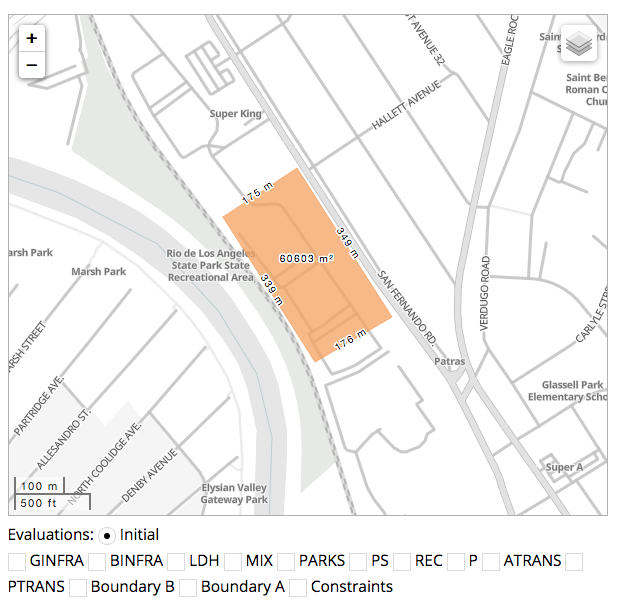
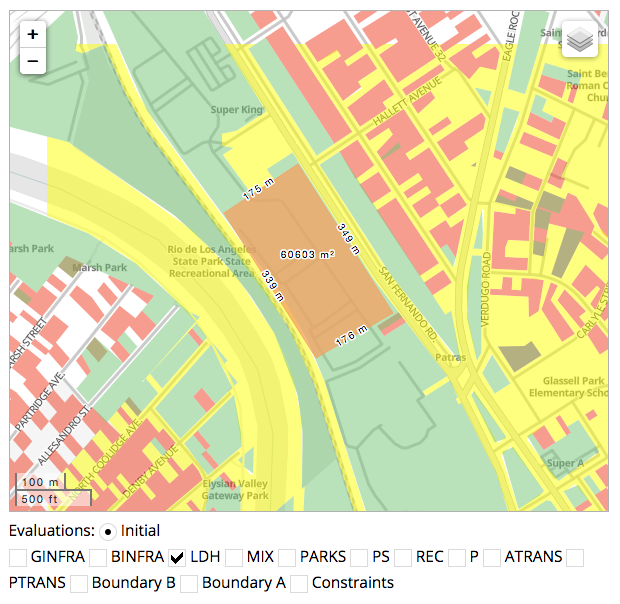
This proposal is overlayed on the evaluation map, as you can see it falls on the “green” part of the map. We are putting housing where the evaluation map says it is capable to support it.
Assessing Impacts
After you press the Compute Impact button, you will see a loading screen indicating that the server is processing your diagrams and selections. Given the amount of computations that are being done, it may take between 15 to 40 seconds to perform these computations. Once the computations are complete, the results will be loaded on the maps.
There are two types of impacts: Self Impacts, impact on its own system and cross system impacts how one diagram affects other systems.
Self Impact
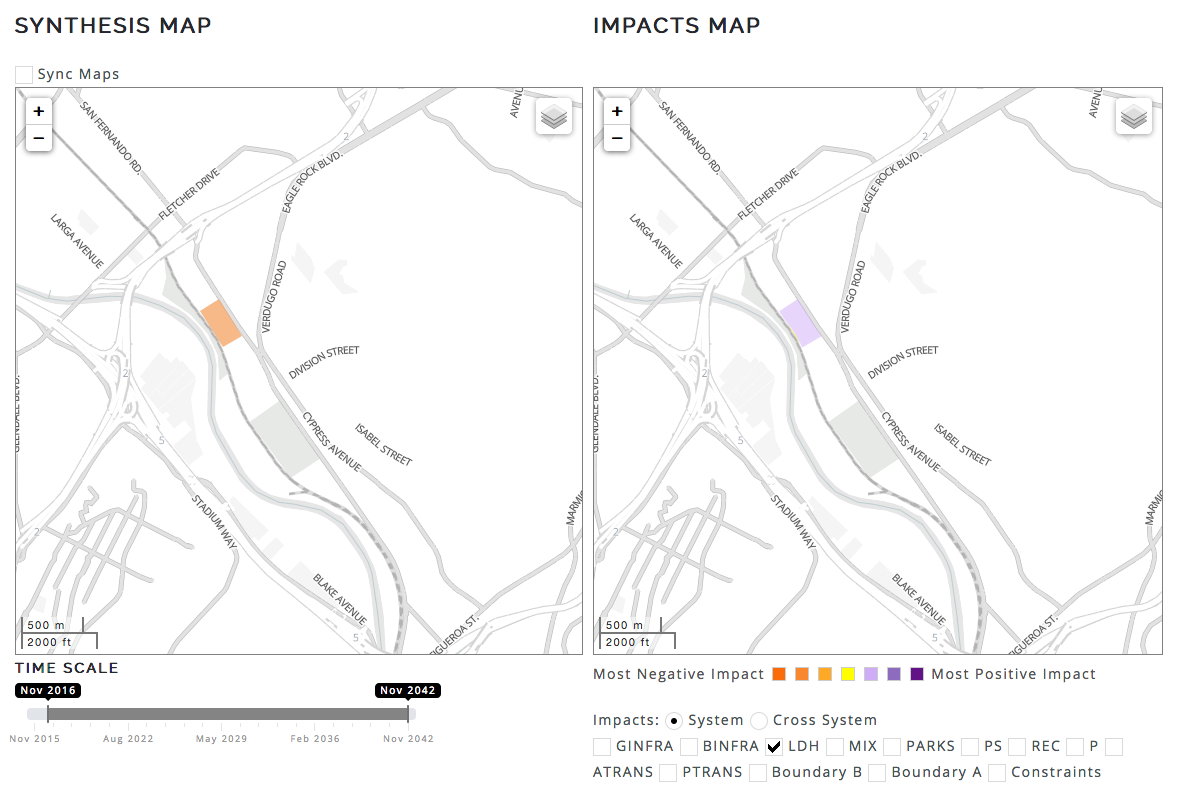
In this box, you see the impacts of the diagrams selected under a system on itself. If a system has an Assessment Map, the diagrams selected in your synthesis that fall under the system will be assessed for impact. The impact is a simple overlap of the diagram over the red, yellow, or green of the assessment. For e.g., after you select a diagram, the tool will look up what system the diagram falls under and then do an intersection analysis to show you how this diagram performs against the assessment. If there are multiple diagrams selected under a system, they will be aggregated together and their impacts shown on the map. In this case the diagram is drawn over a “green” capable part of the evaluation map i.e. it is at a location that supports that intervention therefore the impact is “purple” or positive.
Impacts across systems
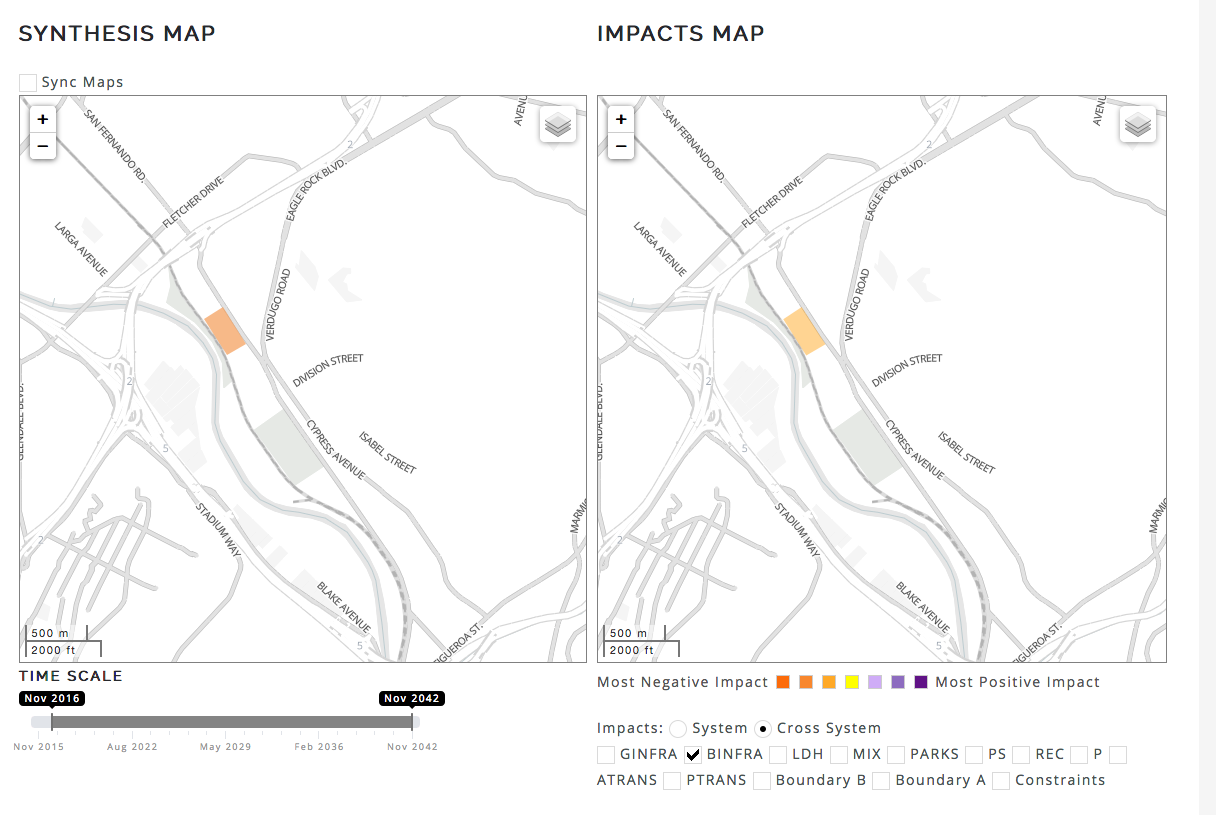
However when we select the “Cross System” radio button and turn on Blue Infrastructure, the impact is negative (Orange) because by placing low density housing there we are having a negative impact on Blue Infrastructure, we are taking away suitable sites from Blue Infrastructure.
Videos
Here is a series of videos explaining this and a PowerPoint presentation.
https://www.youtube.com/playlist?list=PLMq-svjTn2f97-2sgqzDxagJSG2LnSn2y