Once a diagram is selected for synthesis, a timeline visualization appears, as is shown below.
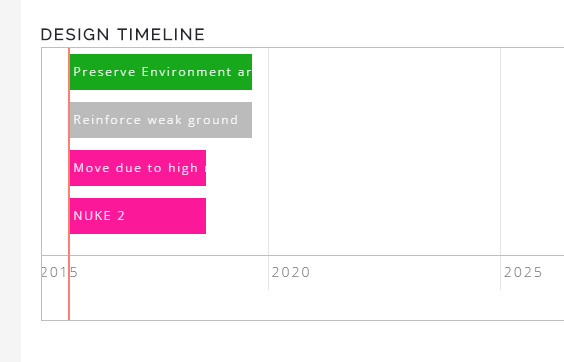
In this case, four diagrams are selected and the bars represent the time that is set by the author of the diagram. You can move these bars to build your project plan and also change the time of completion. For e.g. if the author sets two years for completion of project, you can extend it for your design for more or less. This change of time is applicable to your designs only and does not impact the original selection time.
To move the diagram or to change the diagram time for your design, click on the diagram and it is highlighted yellow as shown below.
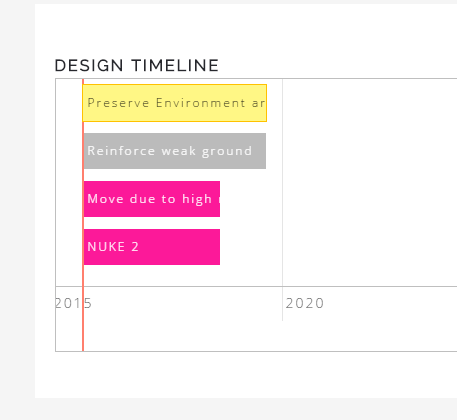
You can keep the mouse clicked and drag the diagram bar or also select the edges to change the start and end times of the diagram.
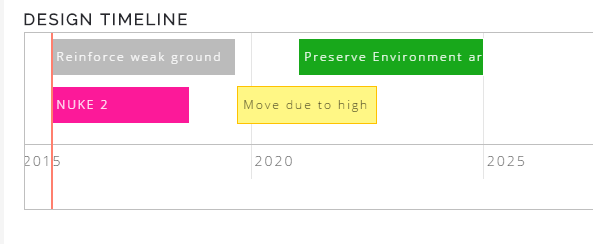
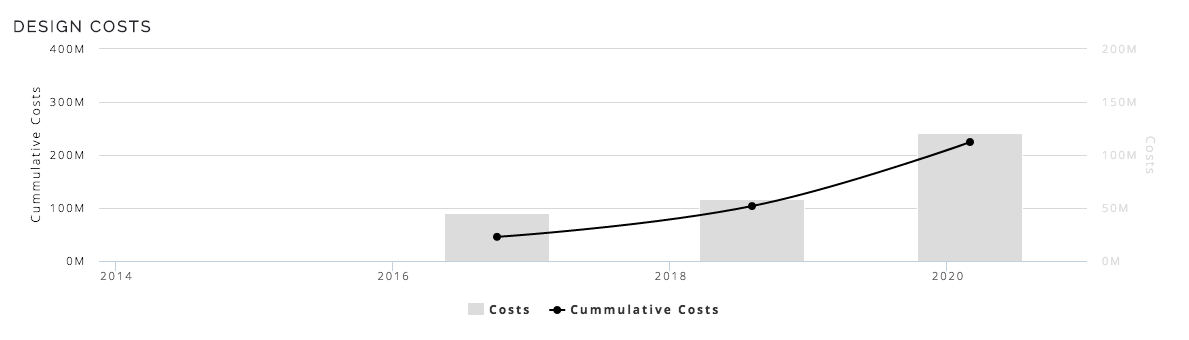
In this way, diagrams can be moved or time changed for your design. Once the diagrams are moved, right underneath is a Design Cost chart. This chart details multi-year investment that is a result of the timeline changes.