In this article, we are excited to share new comparison tools now available in Geodesignhub to help you compare and evaluate two spatial designs side-by-side.
Geodesignhub enables structured bilateral negotiations between two teams. Because these negotiations are map-based, setting up the right context and understanding the spatial relationships are crucial to driving a successful outcome.
Understanding the Negotiation Space
Negotiations in Geodesignhub are modeled as a systematic “give-and-take,” where two parties take turns working through the design grid. For a step-by-step walk-through of this process, see the negotiations article in the Practical Geodesign Course.
To facilitate an effective dialogue, teams build their specific vision for a site and need a clear framework to evaluate similarities, differences, and potential trade-offs. Map-based negotiations require grasping both spatial geometry and the underlying concepts behind each proposal. The foundation for our new analytical tool stems from a theoretical conceptual framework:
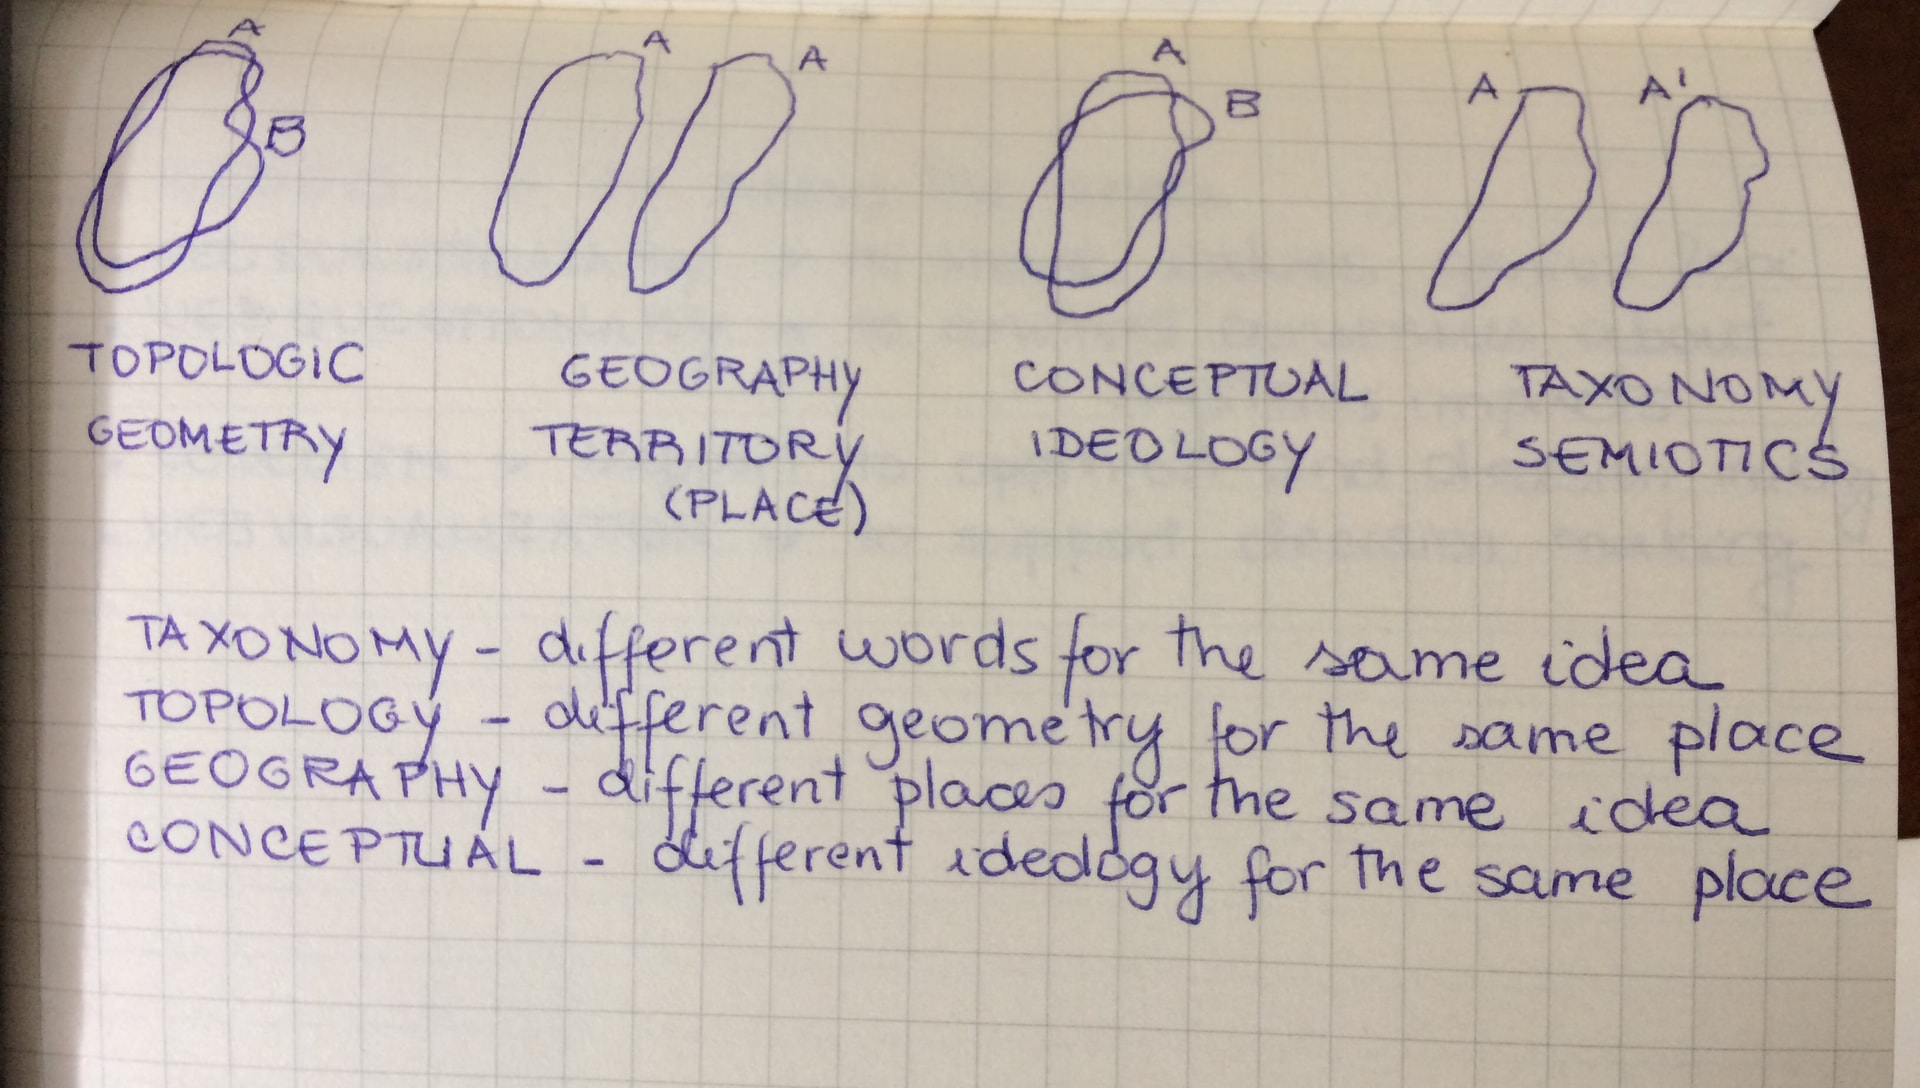
Source: Prof. Ana Clara Moura of the Federal University of Minas Gerais, Brazil.
The 4 Dimensions of Comparison
By analyzing two designs across these four parameters, teams can effectively gauge where consensus exists and where negotiation effort is required:
-
Taxonomy: Different words for the same idea
-
Topology: Different geometry for the same place
-
Geography: Different places for the same idea
-
Conceptual: Different ideology for the same place
Note: While automated spatial metrics provide essential analytical clarity, the human component of negotiation remains vital. The tool sets up the analysis, but active collaboration between people drives the ultimate success.
How it Works: Grid-Based Spatial Analysis
When comparing two loaded designs, simply click the COMPARISON button to view the analysis:
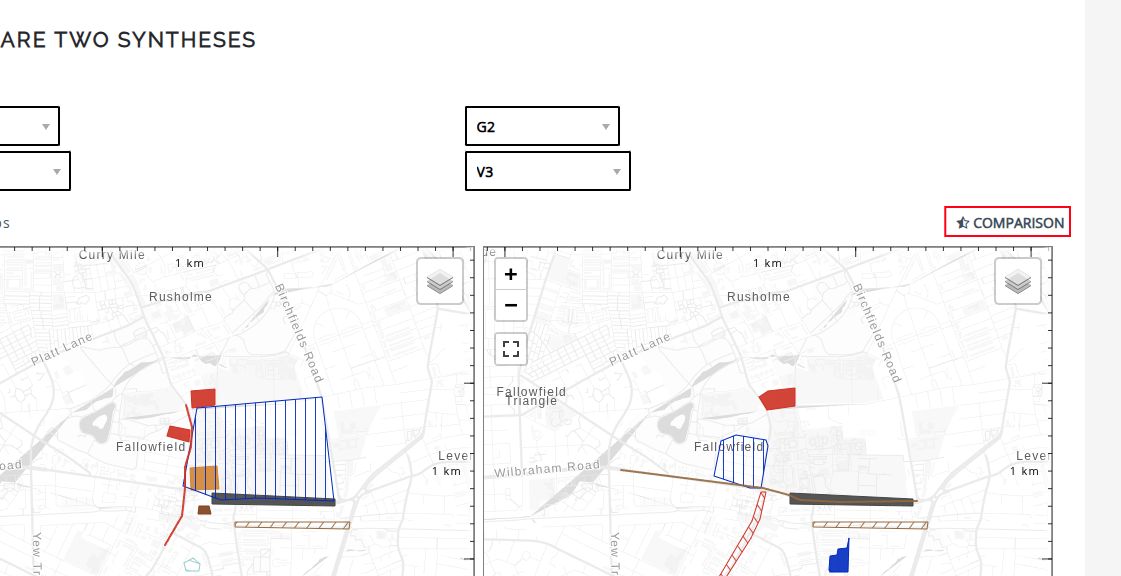
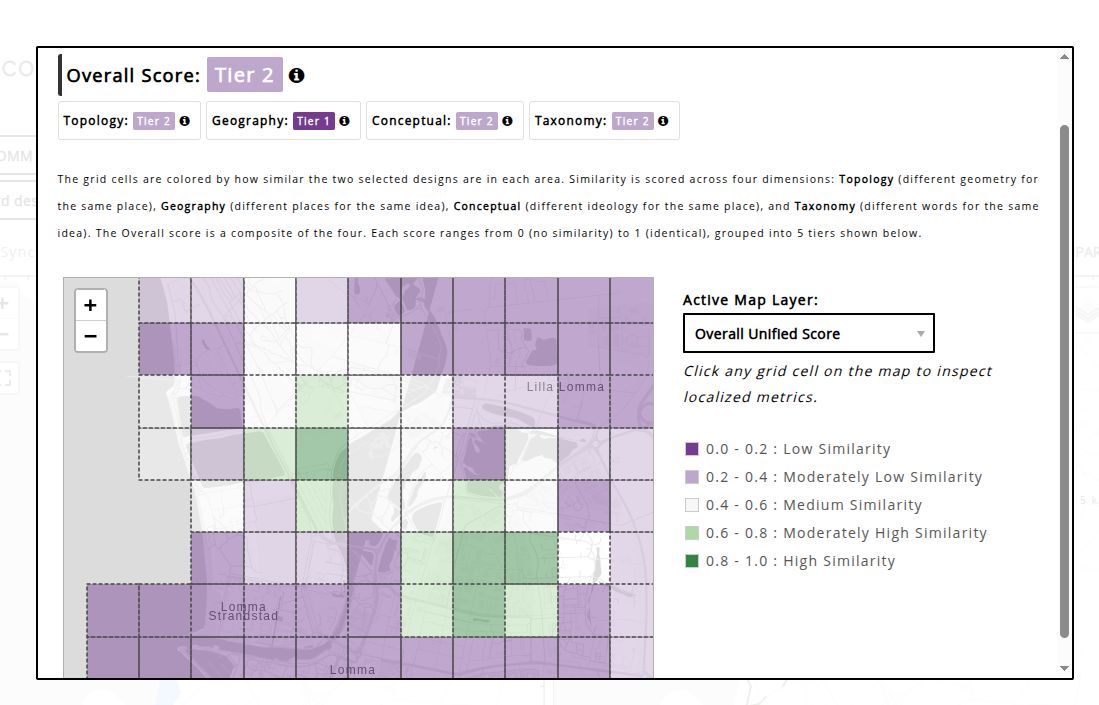
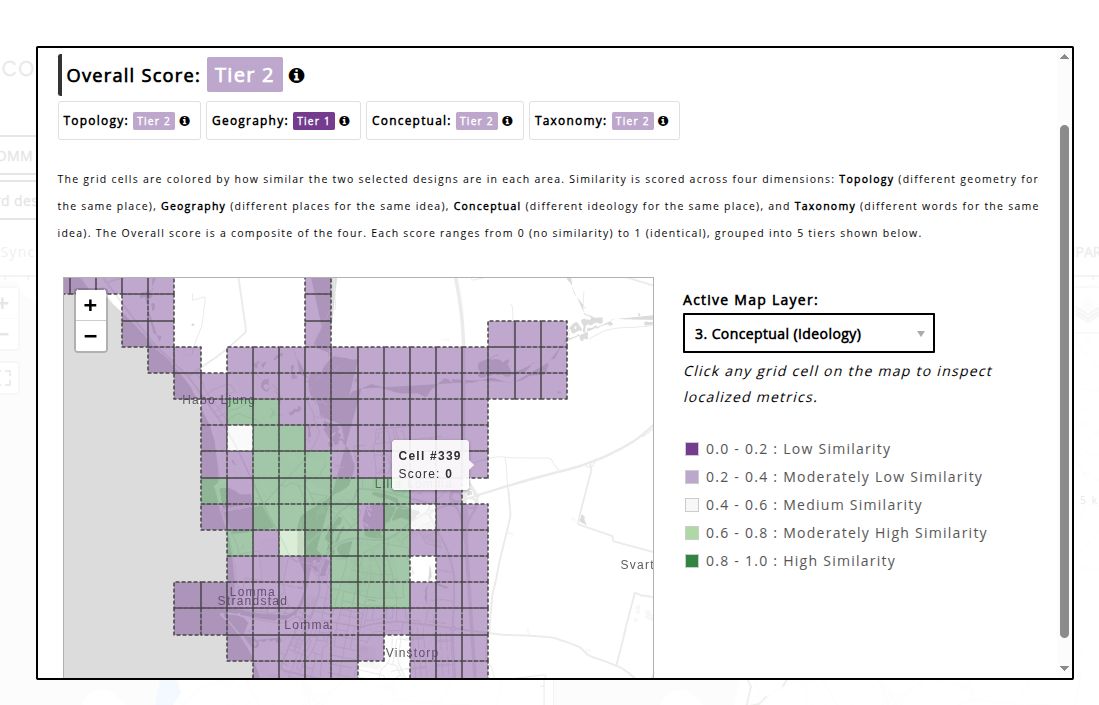
Once launched, the tool divides the study area into a 500m × 500m spatial grid. The individual diagrams constituting each design are systematically evaluated across the four parameters to generate localized raw similarity scores.
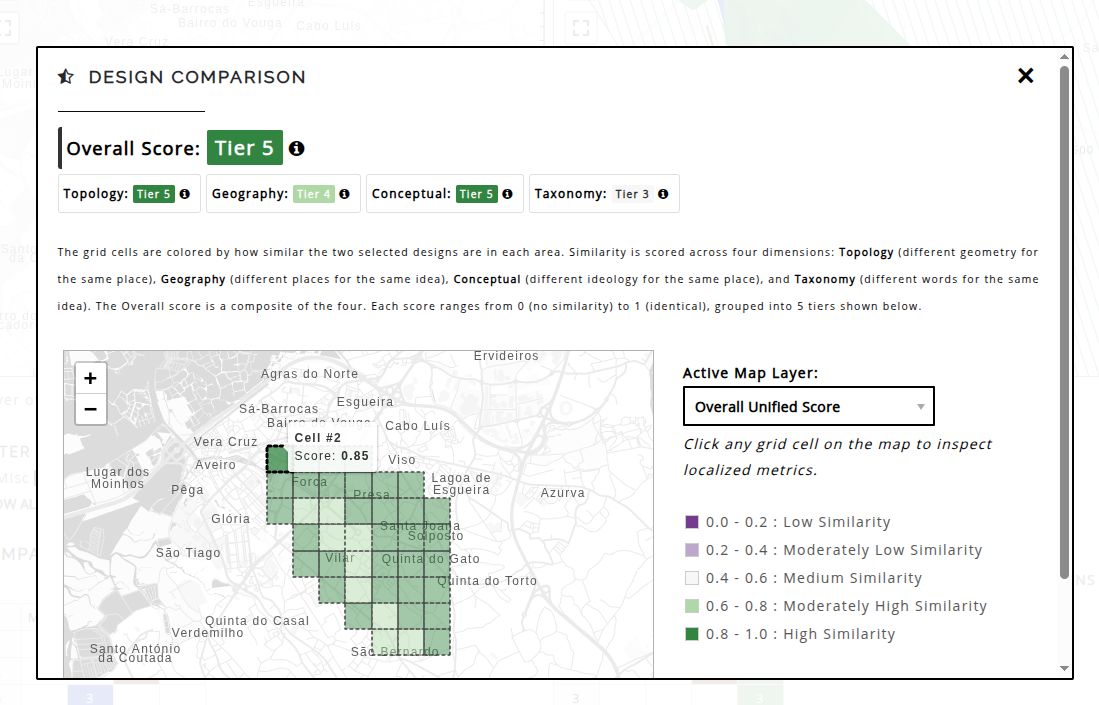
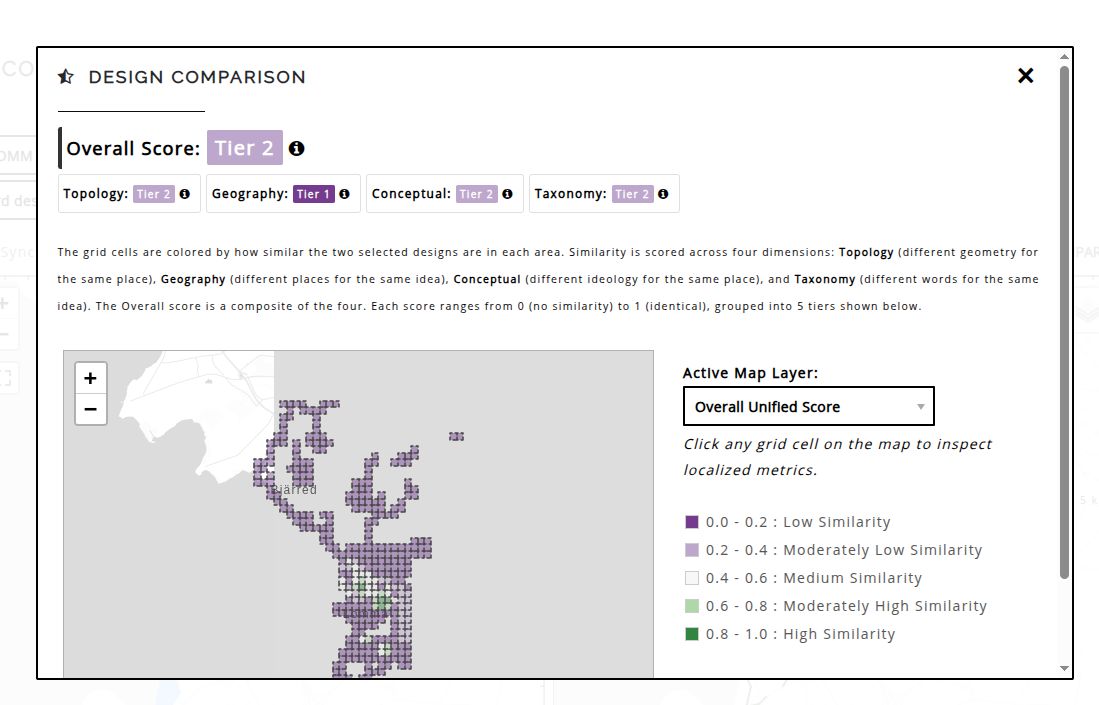
Visualizing Divergence and Alignment
The primary goal is to foster consensus across different domains while pinpointing contentious grid cells early on. By translating spatial data into actionable social negotiation tools, we help teams “set up for success” from the start. The spatial ana
-
Green cells indicate high similarity (low divergence) between the designs in a .
-
Purple cells highlight areas of low similarity (high divergence) that require focused discussion.
Try It Out & Give Us Feedback!
This feature is now live and available for all projects. If you have completed a previous project, we encourage you to load it, run the analysis, and review the results.
We are eager to hear your thoughts: Does the grid breakdown align with your team’s real-world negotiation dynamics? How can it be made better?