In this article I will talk about a important and powerful feature in Geodesignhub: Multiscale analysis. Before I get into the details, let me introduce a couple of concepts.
Scale
Let us start with the basics, when you zoom in and out of a Openstreetmap or Bing map or Google map by pressing the +/- button or pinch to zoom on your device, you are changing scales. Your screen stays the same: the same length and breath but the area that is displayed is totally different. This is in my words “scaling”. You can find out more about zoom levels over at Openstreetmap. This is nicely demonstrated in the image below.
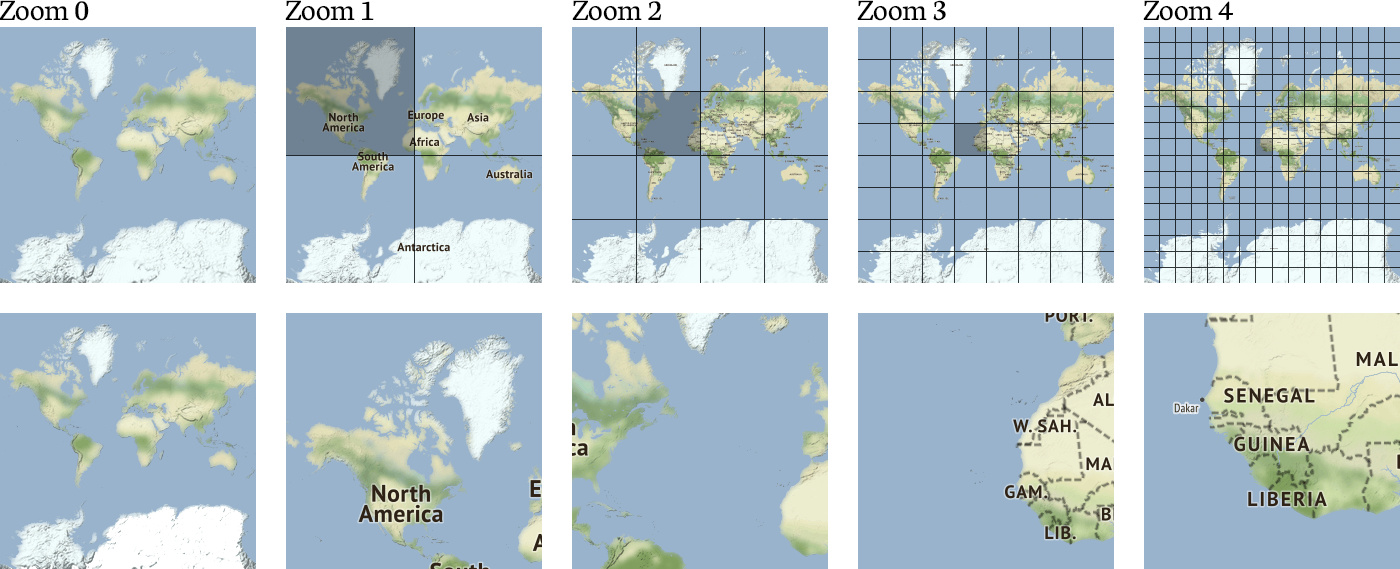
Source
As your “zoom level” increases the area of representation gets smaller, shown in the table below, which I really like:
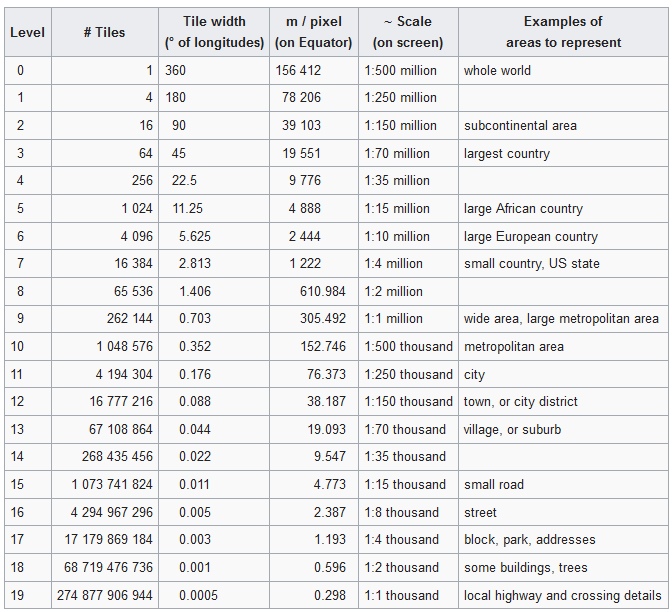
Source
Having introduced scales and zoom levels I want to refresh the concept of boundaries to you and put it in a perspective.
Boundaries
Boundaries are everywhere. For this example I will take the case of India because I was working on a project there recently. Let take a look at administrative boundaries of India.
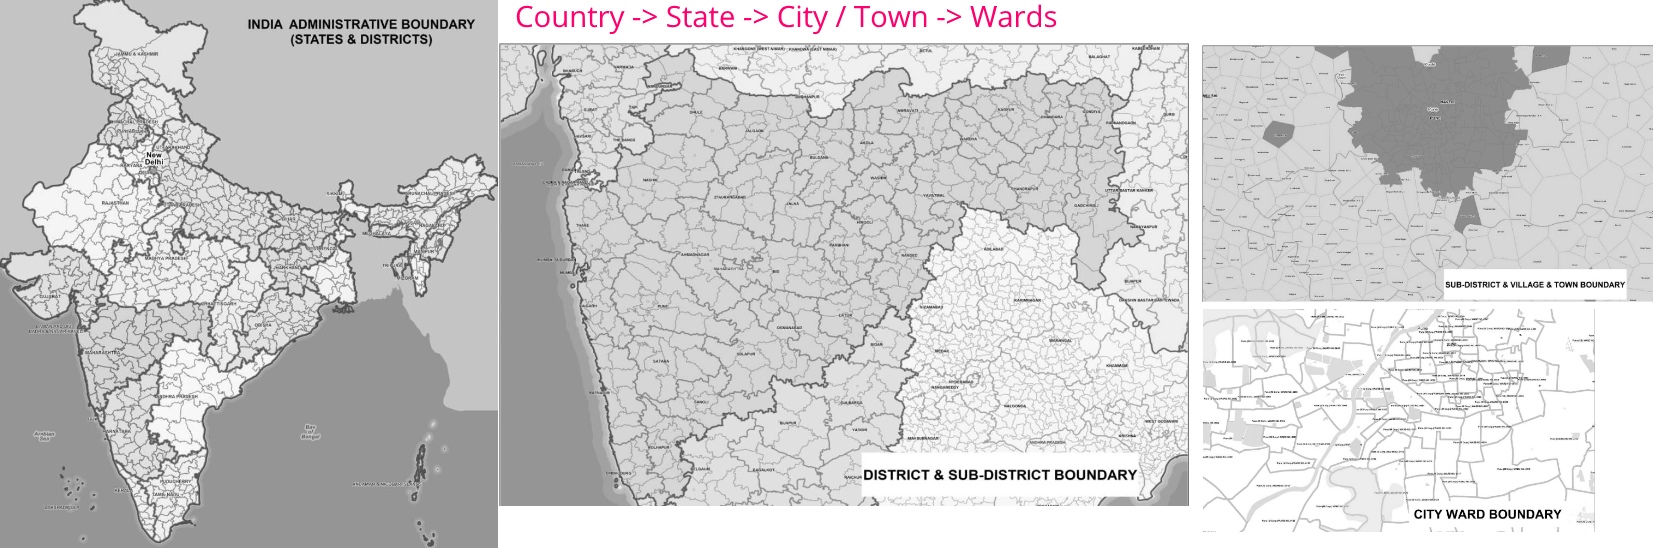
Source
You go from left the entire country to state to districts and cities and wards. This is quite a common way to administratively organize a large geographical entity. There are entire governance systems that are built around these: Central Government / Federal Government, State and City governments, Special zones etc. Each with different responsibilities and sometimes overlapping jurisdictions. This is a example of organizing a area using administrative boundaries. Lets take a look at some other boundaries to go deeper. Below are examples of two more boundaries: watersheds boundaries in India and Forest Cover in India.
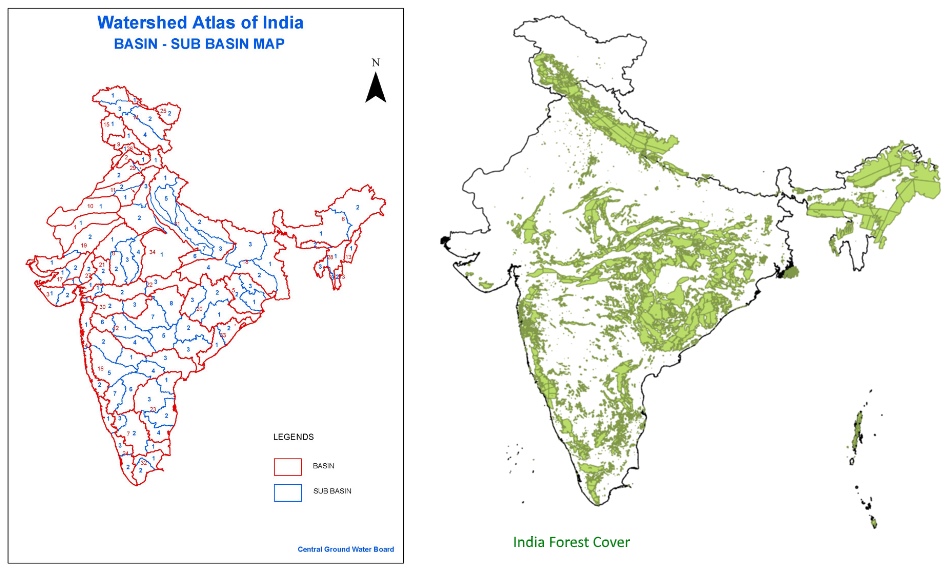
Source Source2
These are “natural” systems and as is well known natural systems know no human boundaries, think of a river that crosses many states or counties. From a governance point of view, if you are in charge of managing the forest cover or a river, you have to interact at all levels of the administration: federal, state, county, city, district etc. It is not just rivers, if you look at the trends of urbanization cities now span multiple counties, and some times states. Effective governance and management and coordination across these sometimes natural or administrative boundaries is a huge issue, it is a organizational, data and management issue.
Mumbai as an example
Recently I worked on a small project in Mumbai. Mumbai has one of the highest density of population and the project was around building housing at a area near the mangroves which are critical for flood prevention. In addition the area had encompassed many boundaries. Mumbai is a massive city organized in wards but there are other boundaries in it as well. You can take a look at some of these boundaries at the fantastic: Login Mumbai portal.
Take a look at the video below that demonstrates how some boundaries overlap in Mumbai

Even though there are boundaries for good reasons we live in a interconnected world. What one does in their boundary will impact the others outside of their boundary. Co-ordination across boundaries is a huge issue, in fact overcoming silos in administration is a major activity.
There is another issue that is critical that I don’t want to get too much into: How to change boundaries? Across the world, new states are formed, districts created, split etc. frequently. In fact a lot of boundaries are fluid but how do you know one proposed boundary is better than the other?
Administration across boundaries is a critical piece of capability that needs to be embedded into governance. This is understood by anyone who is in-charge of management of a cross-boundary entity. To be clear, co-ordination across boundaries already exists at different levels e.g. counties, cities, neighbors routinely coordinate with each other, but it is getting more and more difficult given the complexity. e.g. if I put housing here what is it going to do to the bus stop in the next ward or the road etc. This is the kind of problem we were working on in Mumbai. I want to discuss a digital capability that institutionalizes it and leverages all the advantages of digital computing to help solve this problem.
Boundaries tooling
Every project in Geodesignhub comes with facility to add two sets of boundaries. These are simply a set of polygons that can could be any kind of boundaries: administrative, cultural, economic or even hypothetical or proposed ones. This is shown below for the Mumbai project where you have the ward boundaries as “Boundary A” and the “Mangroves / Urban” boundary as Boundary B.

Switching boundaries
At any time you can switch boundaries (or scales) and the entire project will switch to that selected scale. Of course you can always go back to the “default” scale. When a boundary is changed the entire user interface switches to the selected boundary.

Switching boundaries only switches the boundary for you so you can always switch back and forth. What this really means is that you can see interventions at a “state” level, or “ward” level or “watershed” level or “forest” level. This is very powerful because the same interface and user interface adapts to the administrative role you are in, but the language and symbology is consistent. Take a look at how it works below:

Why does it matter?
We are enabling transparent, effective collaboration between actors at different scales and breaking down existing silos without having to compromise on their workflows using digital technology. In a increasingly complex world with many stakeholders and administrative structures, how do you navigate and bring all the stakeholders on the same page and move forward. How do you utilize digital tools to enable seamless coordination.
The way it works in a project is the following: to begin with you talk to all the entities in the study-area at all the “boundaries”, have them share their management activities, areas of concern etc. for e.g. all the new road proposals etc., lands slated to be conserved, allocation land for housing etc. Then you upload all these “diagrams” in Geodesignhub and conduct a intense focused meeting where the stakeholders see how their activities fit in the larger picture and negotiate while maintaining their own boundary.
Even more
Now that I have introduced boundaries tool, I plan introduce even more sophisticated asset and financial analysis tools that we use in conjunction with boundaries to understand how money, people and goods flow across boundaries, you can have a sneak peak here: Boundary Asset and Investment Analysis.